Baltimore: City Employee Salaries 2015
On the menu this week are the salaries of Baltimore City employees for the 2015 fiscal year, a popular data set available at Open Baltimore. These data include both annual salaries and gross pay, and we’ll start off this post with the top ten for each category. Not too surprising, those who hold senior positions in the city’s government receive the highest annuals salaries:
| Name | Title (Agency) | Annual Salary |
|---|---|---|
| Marilyn Mosby | State’s Attorney (State’s Attorney’s Office) | $238,772 |
| Anthony Batts | Commissioner (Police) | $211,785 |
| Leana Wen | Executive Director III (Health) | $200,000 |
| Henry Raymond | Executive Director III (Finance) | $192,500 |
| Kaliope Parthemos | Executive Director V (Mayor’s Office) | $178,900 |
| William Johnson | Executive Director III (Transportation) | $176,015 |
| Niles Ford | Executive Director III (Fire) | $171,700 |
| Stephanie Rawlings-Blake | Mayor (Mayor’s Office) | $167,449 |
| Mary Talley | Executive Director III (Human Resources) | $167,000 |
| Rudolph Chow | Director (Public Works) | $166,500 |
Oddly, six of the ten employees with the highest gross pay are from the police department:
| Name | Title (Agency) | Gross Pay |
|---|---|---|
| Stephen Nalewajko Jr | Lieutenant (Police) | $235,767 |
| Anthony Batts | Commissioner (Police) | $210,705 |
| Marc Camarote | Sergeant (Police) | $210,508 |
| William Harris Jr | Sergeant (Police) | $207,614 |
| Rhonda Johnson | Paramedic (Fire) | $205,999 |
| Mark Walrath | Lieutenant (Police) | $194,655 |
| Derrick Turrentine | Paramedic (Fire) | $193,532 |
| Henry Raymond | Executive Director III (Finance) | $189,892 |
| Albert Marcus Sr | Officer (Police) | $186,593 |
| Kaliope Parthemos | Executive Director V (Mayor’s Office) | $183,085 |
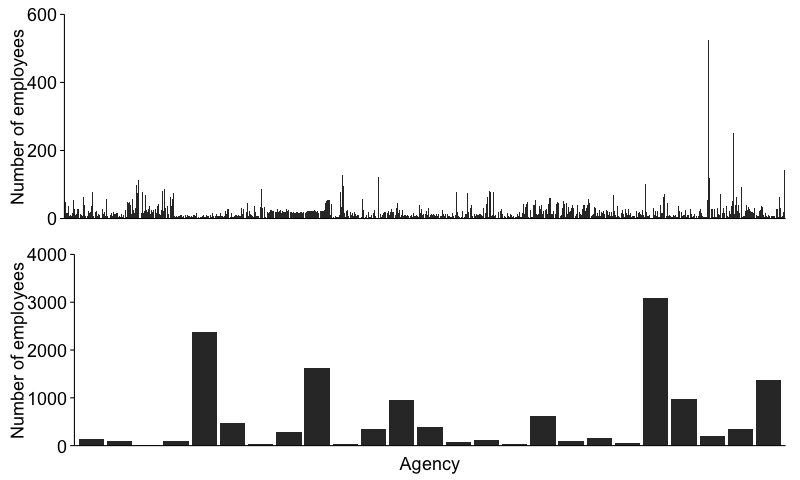
Unfortunately, each government agency is further subdivided, creating a total of 673 sub-agencies. For example, the Department of Transportation contains a sub-agency representing their 305 crossing guards (median salary: $10,546). The large number of sub-agencies complicates meaningful comparisons; however, grouping them together by their parent agency and excluding those with less than ten employees results in 25 agencies, a more manageable number. This grouping can be visualized below:
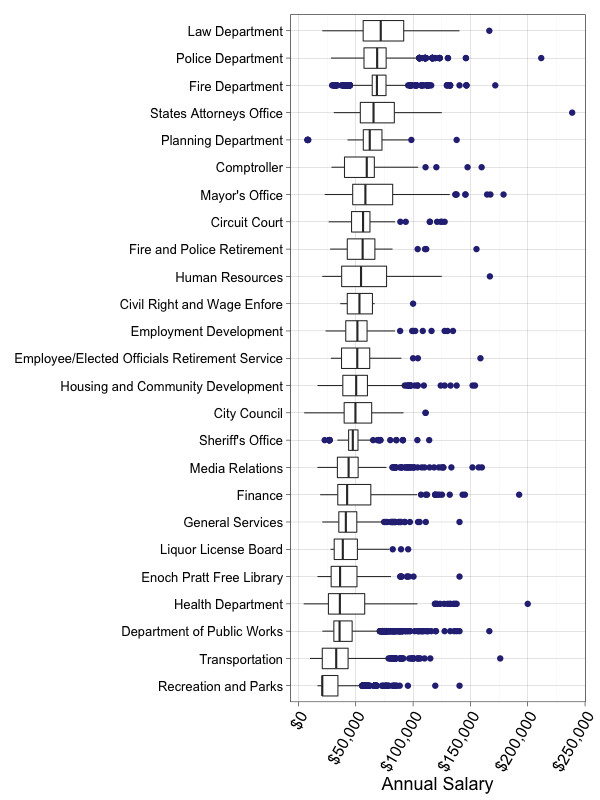
Having aggregated the sub-agencies into their parent agency, it is now practical to compare them using a box plot. The “box” represents the middle half of all salaries (i.e. the range of salaries extending from the first to the third quartile). The vertical line within each box indicates the median salary, the point at which half of the salaries fall above or below. Loosely phrasing, the lines extending from the box represent salaries greater or less than those in the box, while the purple points represent ‘outliers,’ salaries that are either much higher or lower than the rest. Below is a box plot summarizing the annual salaries for each agency, ordered by their median:
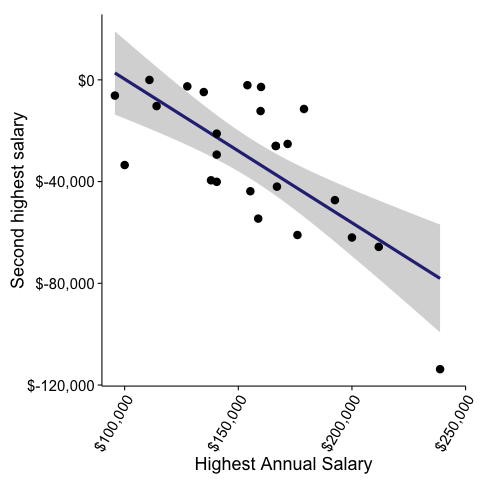
For some agencies, such as the State’s Attorney’s Office, there is a large difference between the highest salary and the next highest one (an outlier among outliers!). Below is a table of the highest and second highest salary, the later expressed as the difference from the highest salary, for each agency:
| Agency | Highest Annual Salary | Next Salary |
|---|---|---|
| State’s Attorney’s Office | $238,772 | -$113,772 |
| Police Department | $211,785 | -$65,685 |
| Health Department | $200,000 | -$62,000 |
| Transportation | $176,015 | -$61,005 |
| Employee/Elected Officials Retirement Service | $158,760 | -$54,560 |
| Finance | $192,500 | -$47,300 |
| Fire and Police Retirement | $155,300 | -$43,800 |
| Human Resources | $167,000 | -$42,000 |
| Enoch Pratt Free Library | $140,500 | -$40,100 |
| Planning Department | $138,000 | -$39,500 |
| Civil Right and Wage Enfore | $100,000 | -$33,500 |
| General Services | $140,500 | -$29,400 |
| Department of Public Works | $166,500 | -$26,000 |
| Law Department | $166,500 | -$26,000 |
| Fire Department | $171,700 | -$25,200 |
| Recreation and Parks | $140,500 | -$21,150 |
| Comptroller | $159,800 | -$12,275 |
| Mayor’s Office | $178,900 | -$11,451 |
| Sheriff’s Office | $114,050 | -$10,307 |
| Liquor License Board | $95,700 | -$6,187 |
| Employment Development | $134,800 | -$4,800 |
| Media Relations | $160,000 | -$2,800 |
| Circuit Court | $127,560 | -$2,560 |
| Housing and Community Development | $154,000 | -$2,100 |
| City Council | $110,908 | -$31 |
Plotting these data suggested a negative correlation between the highest salary and its difference from the second highest one. In other words, as the highest annual salary increases, there is a larger difference between it and the next highest salary.
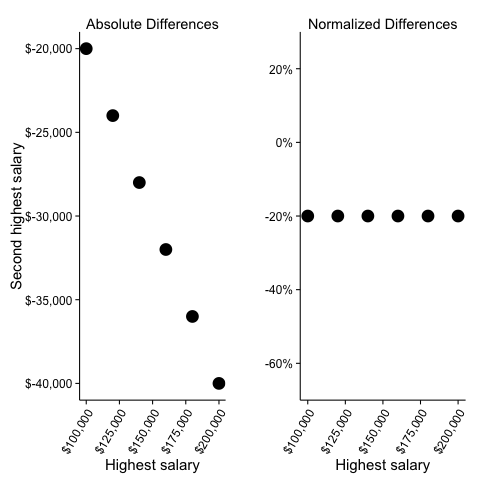
One interpretation of these data is that they represent absolute differences between the two highest salaries rather than relative, or normalized, differences. For example, if the highest salary across agencies varies from $100,000 to $200,000 and the second highest salary in each agency is consistently 20% less, graphing their relationship in absolute differences produces the plot on the left below. However, if the data in this hypothetical example is normalized by dividing the second highest salary by the highest salary, the trend disappears, as illustrated by the plot on the right:
An identical transformation of the annual salaries, however, reveals that this interpretation does not explain the data because the same trend persists:
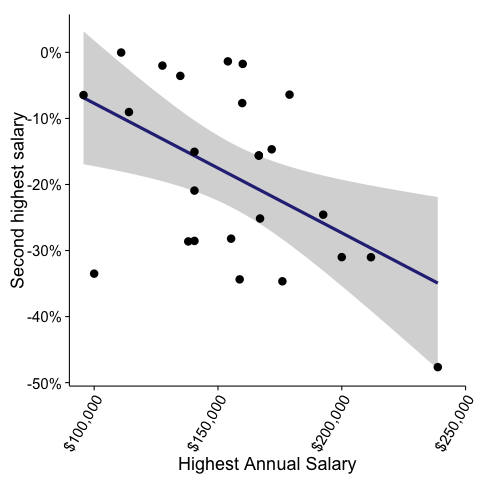
Below is a table of the highest and second highest salary, the later expressed as a normalized difference from the highest salary, for each agency:
| Agency | Highest Annual Salary | Next Salary (% of highest) |
|---|---|---|
| States Attorneys Office | $238,772 | -47% |
| Transportation | $176,015 | -34% |
| Employee/Elected Officials Retirement Service | $158,760 | -34% |
| Civil Right and Wage Enfore | $100,000 | -33% |
| Police Department | $211,785 | -31% |
| Health Department | $200,000 | -31% |
| Planning Department | $138,000 | -28% |
| Enoch Pratt Free Library | $140,500 | -28% |
| Fire and Police Retirement | $155,300 | -28% |
| Human Resources | $167,000 | -25% |
| Finance | $192,500 | -24% |
| General Services | $140,500 | -20% |
| Department of Public Works | $166,500 | -15% |
| Law Department | $166,500 | -15% |
| Recreation and Parks | $140,500 | -15% |
| Fire Department | $171,700 | -14% |
| Sheriff’s Office | $114,050 | -9% |
| Comptroller | $159,800 | -7% |
| Liquor License Board | $95,700 | -6% |
| Mayor’s Office | $178,900 | -6% |
| Employment Development | $134,800 | -3% |
| Circuit Court | $127,560 | -2% |
| Media Relations | $160,000 | -1% |
| Housing and Community Development | $154,000 | -1% |
| City Council | $110,908 | < -1% |
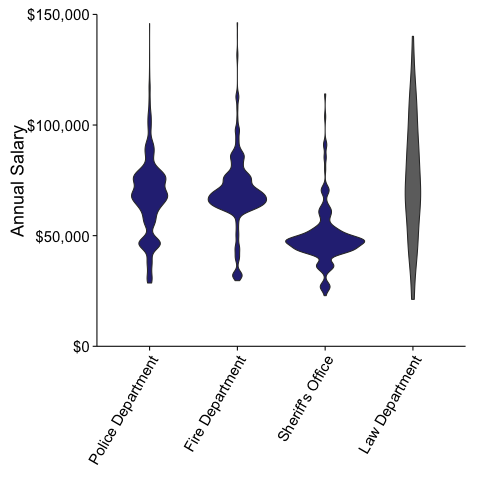
Finally, a somewhat different plot can highlight unique features of an agency. Below are violin plots of the annual salaries for the Police, Fire, Sheriff and Law Department. In these plots, the width reflects the probability of salaries corresponding to each annual salary. The ‘lumpiness’ seen for the Police, Fire and Sheriff’s Department presumably reflect step-wise increases in pay grades. In contrast, salaries within the Law Department are more continuous with no discernible structure, as seen below:
That’s it for this post. Please stay tuned for the next one!
Reproducibility
- R script (also in Python)
- A copy of the Baltimore City Employee Salaries FY2015