Baltimore: Geographic Distribution of Arrests
Open Baltimore contains detailed data on arrests since 2013. For each arrest, the type of offense and its location is reported (although a frustrating 61% are classified as “Unknown Offense”). For almost all offenses, mapping their locations reveals no clear trends, except for those classified as prostitution, as seen below:
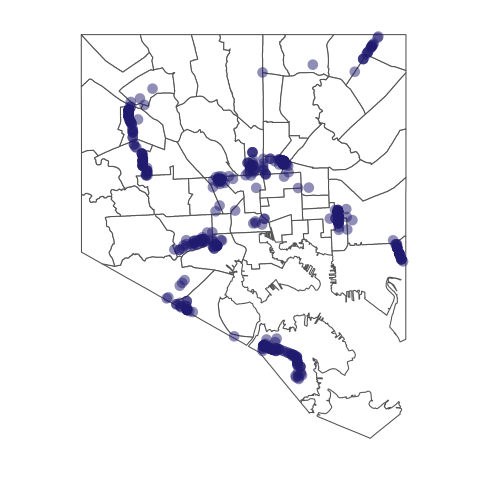
These arrests tend to cluster, with dark purple regions indicating multiple arrests in close proximity. This presentation of the data, however, prevents accurate comparisons due to overplotting. The large range of arrests occurring at a single location are visually limited by the number of purple shadings. In other words, the darker shades of purple may represent a broad number of arrests. A density plot of the same data attempts to circumvent this concern, as seen below:
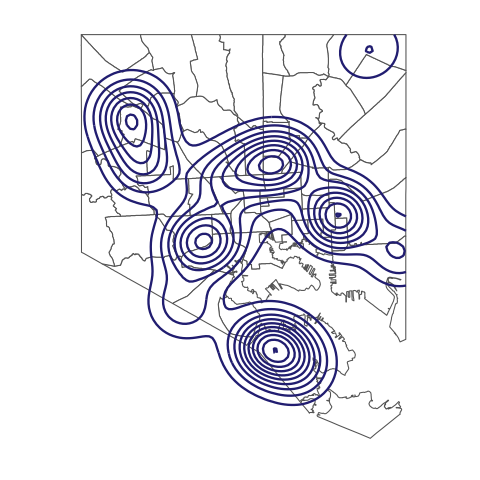
This plot reveals five regions where the majority of arrests occur. A more formal method to uncover a similar pattern is to construct a hierarchy of the distances between arrest locations. Doing so, and then establishing a criteria to delineate clustered arrests (the dotted line) creates six groups:
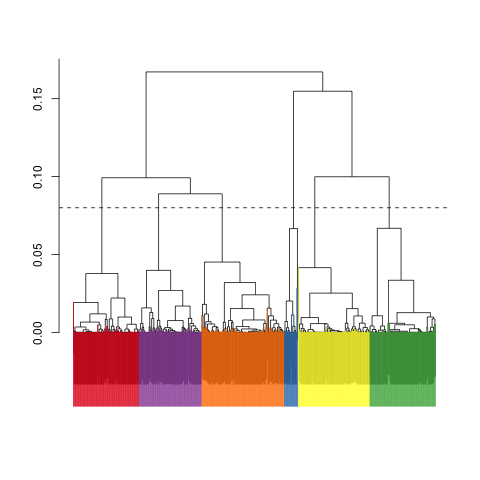
The geographic location of these groups is seen below:
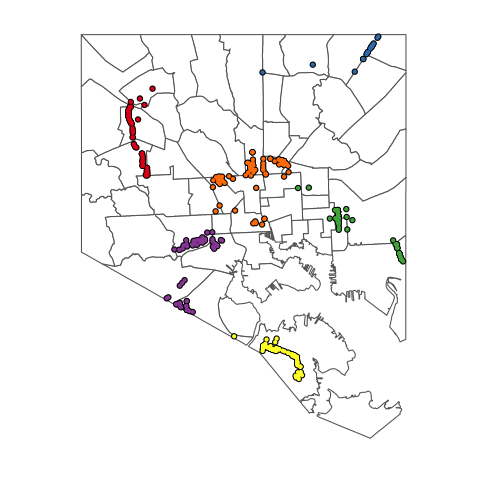
Overlaying the density plot reveals that these groups reflect the high density areas previously noted:
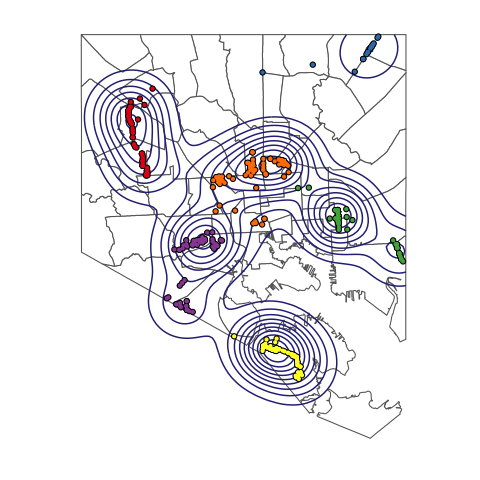
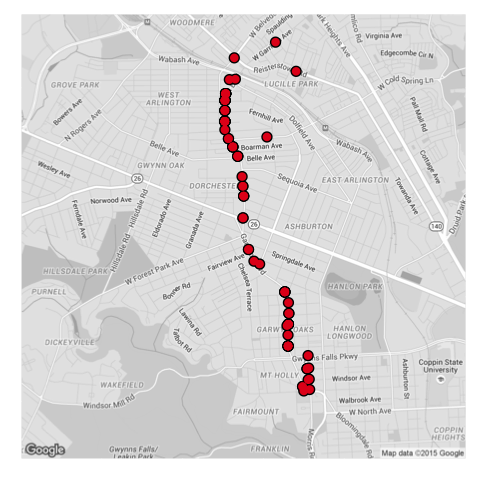
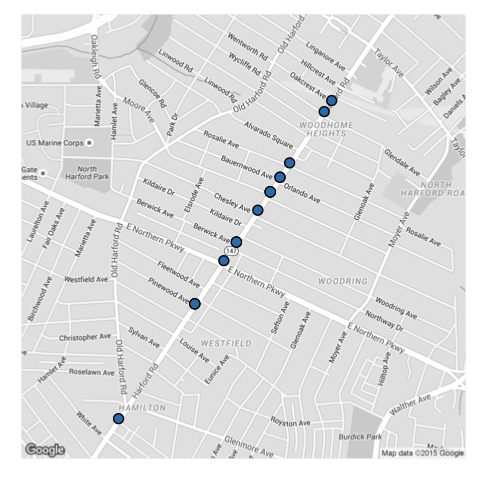
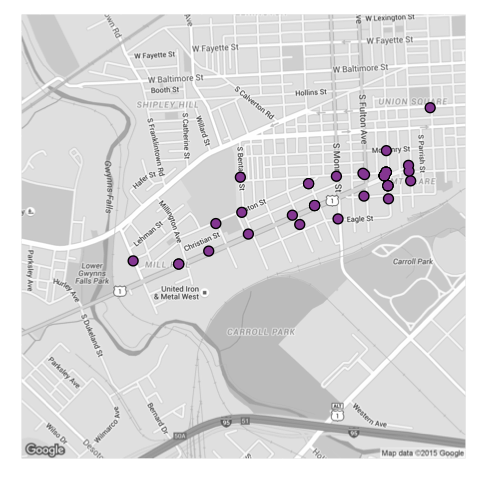
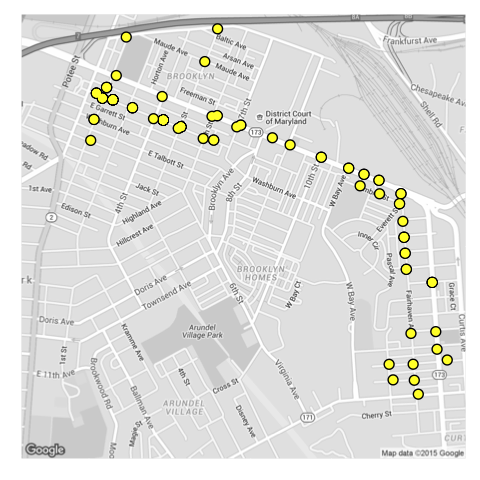
Finally, for many groups, arrests commonly occurred on a single street or congregated around one. Mapping the location of an arrest to a road map illustrates this point for four of the six groups:
That’s it for now. Thanks for checking out the site and stay tuned!
Reproducibility
- R script
- A re-formatted file of neighborhood polygons
- Arrests from Open City Baltimore.