Baltimore: Vehicle Towing
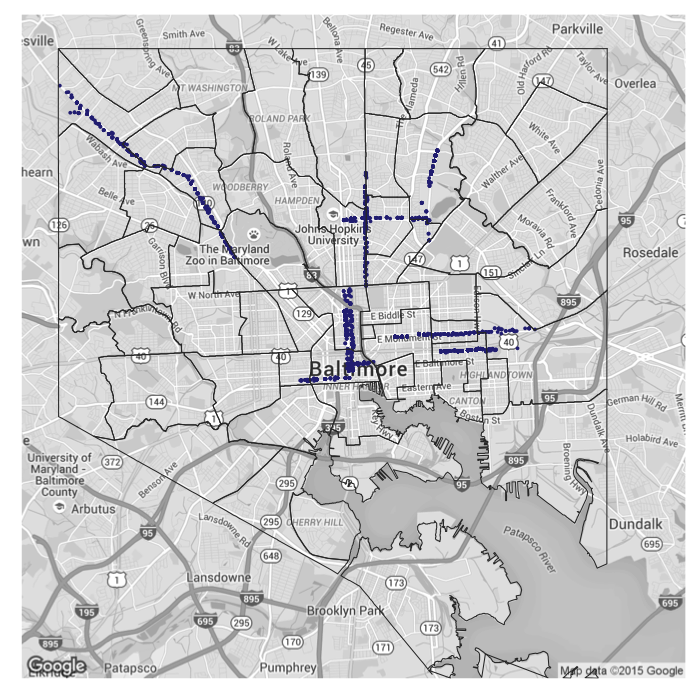
This week’s post concerns vehicle towing, which hopefully will be more interesting that you might imagine. The data comes from Open Baltimore and consists of approximately 62,000 vehicles towed over the last five years (October 23rd, 2010 to November 12th, 2015). Unfortunately, for each towing, a street address, rather than a latitudinal and longitudinal coordinate, is recorded. However, thanks to the power of Google (and a few bucks from yours truly), it is possible to convert almost all of these addresses (98.3%) into latitudinal and longitudinal coordinates, which can then be visualized. Doing so gives a broad overview of towing in the city:
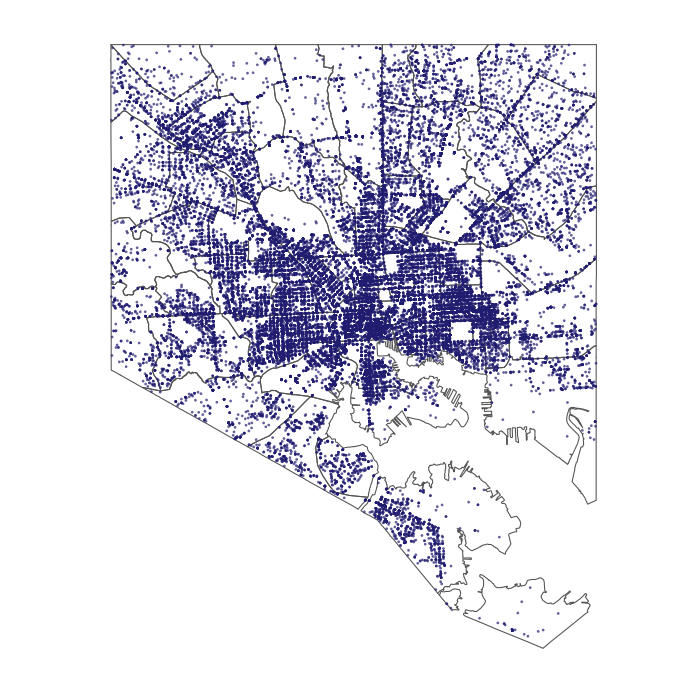
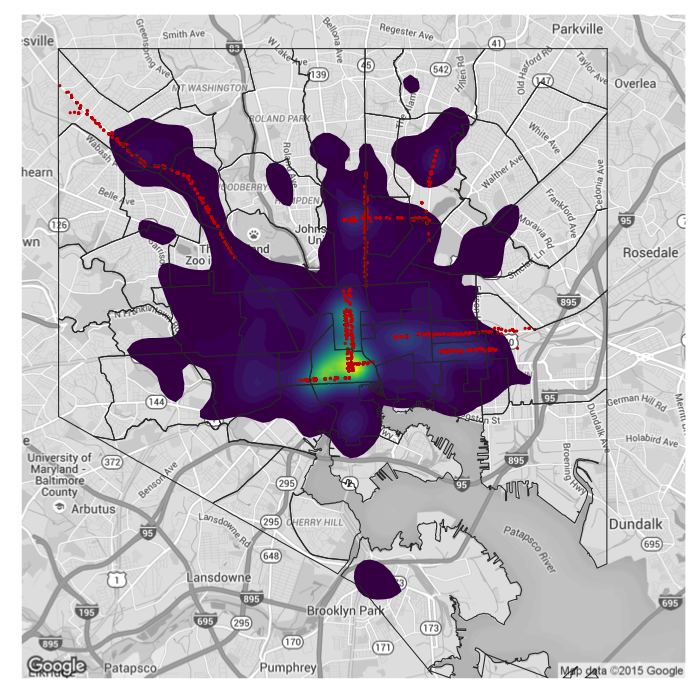
From the above visualization it is possible to discern that the majority of towing occurs downtown. However, it is difficult to accurately compare between regions due to overplotting (i.e. the number of vehicles towed from the same location cannot be differentiated). A two dimensional density plot circumvents this concern:
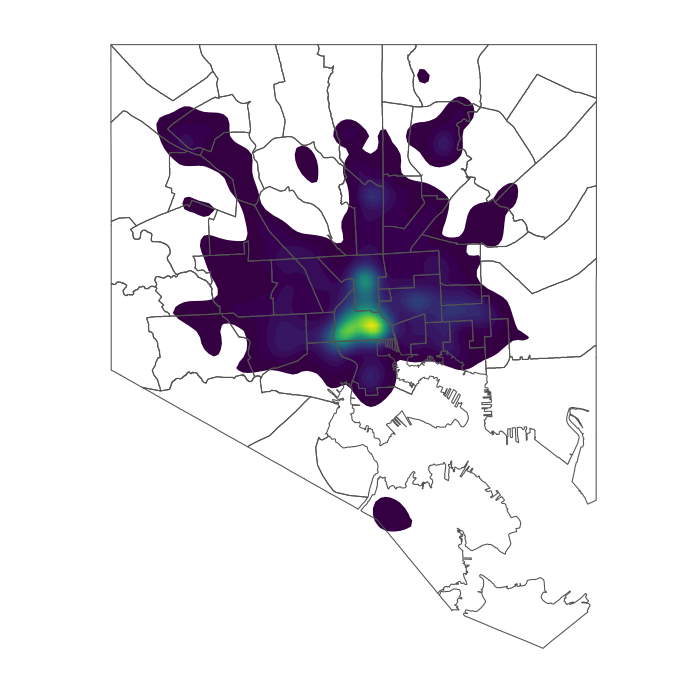
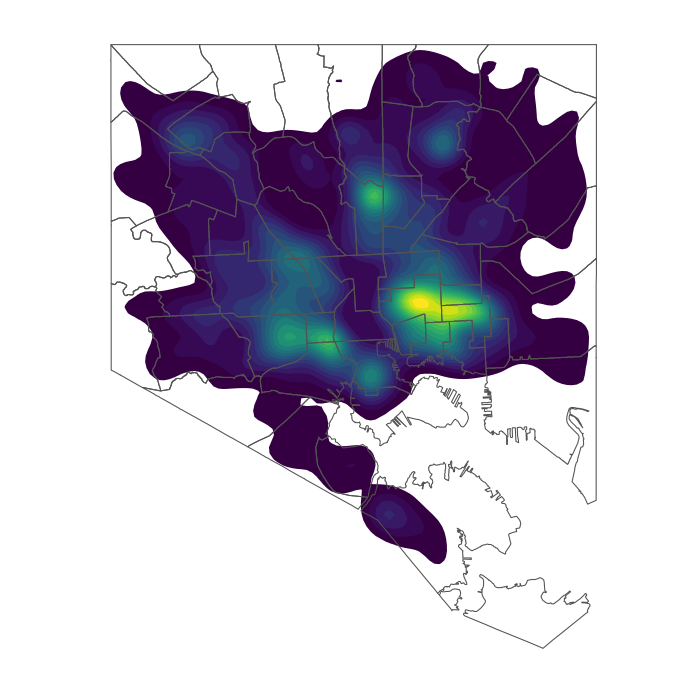
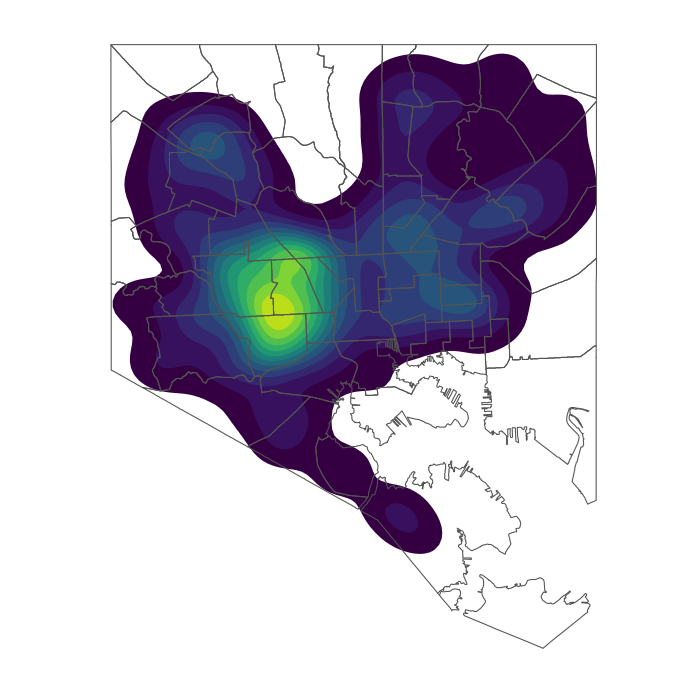
The disproportional number of vehicles towed from downtown visually compresses the variation between other regions of the city. After excluding downtown and midtown, the same plot highlights other areas of the city with a large number towed vehicles.
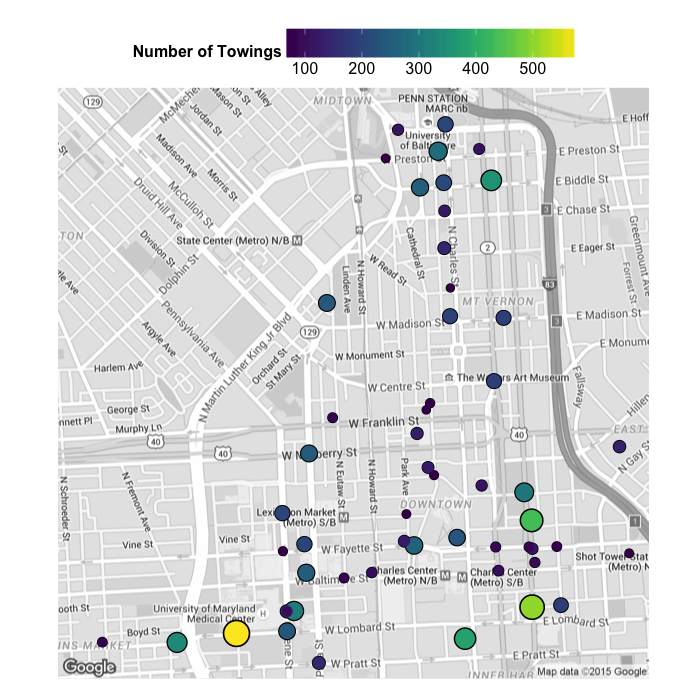
With latitudinal and longitudinal coordinates, it is possible to pinpoint exact locations with the greatest number of towed vehicles. Not surprisingly, the majority of these points were downtown, although a notable number occurred at the MedStar Union Memorial Hospital to the north and at the Johns Hopkins Medical Institute to the east:
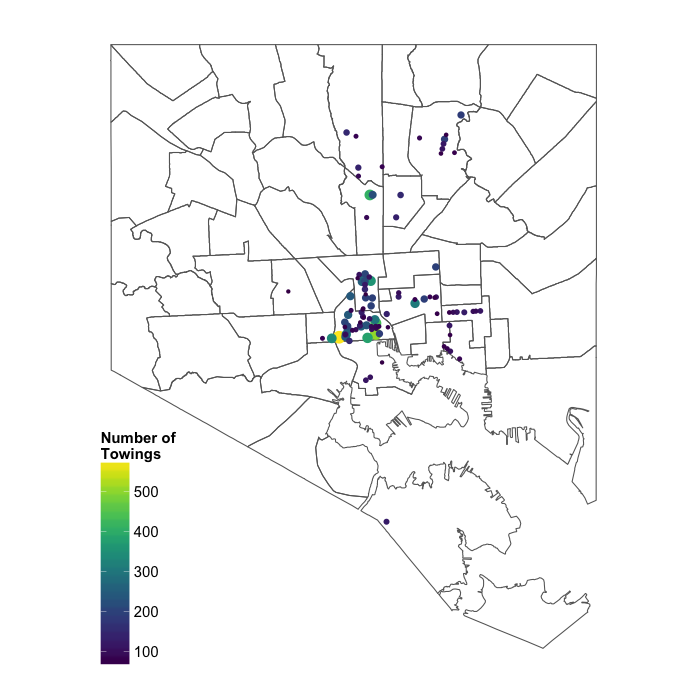
In line with the above observations, the University of Maryland Medical Center, in the lower left hand corner below, topped the list with the greatest number of vehicles towed:
Additionally, specific streets had a disproportional number of vehicles towed. The top ten streets, reflecting ~12.5% of all towing, are:
| Street | Number of Towing |
|---|---|
| N. Charles St. | 1159 |
| W. Lombard St. | 1018 |
| E. Fayette St. | 849 |
| E. 33rd St. | 813 |
| Reisterstown Rd. | 759 |
| Hillen Rd. | 698 |
| St. Paul St. | 670 |
| Greenmount Ave. | 577 |
| E. Monument St. | 559 |
| E. Lexington St. | 533 |
Plotting these points over a road map captures their geography:
Overlaying these points with the density map from above illustrates that these streets significantly contribute to areas of high density towing:
Dude, where’s my car?
For each towing, whether the vehicle was flagged for being stolen is noted. Many of the vehicles marked as stolen were towed from neighborhoods in west Baltimore:
Turf wars
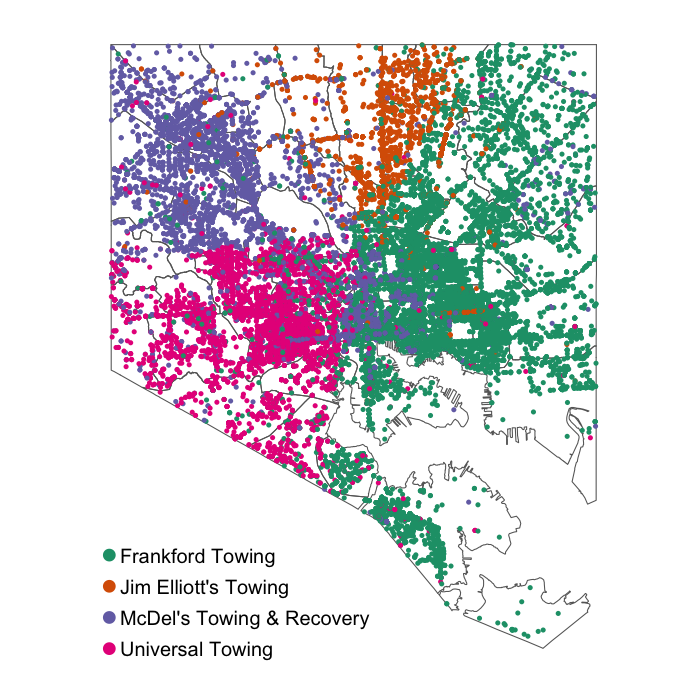
Finally, the data also includes which company towed the vehicle. Plotting the six companies responsible for ~95% of all towing reveals clear regional differences:
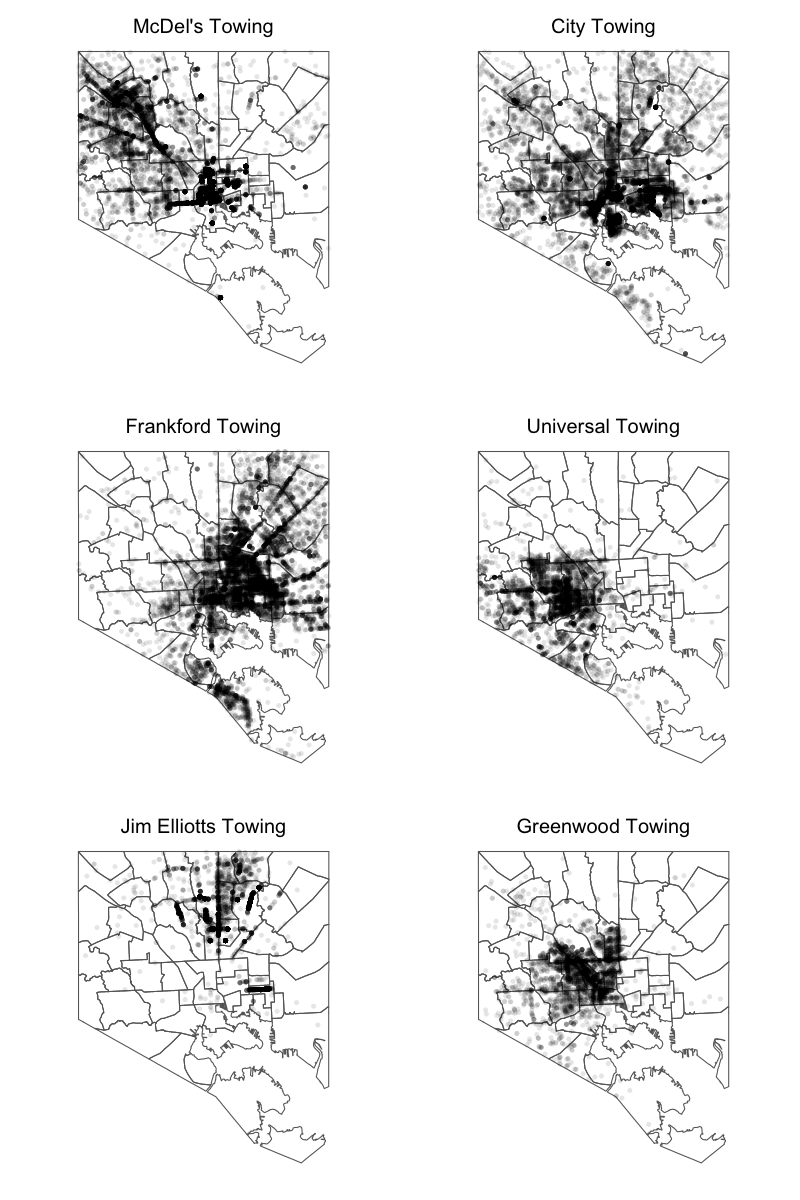
Many companies compete for the high number of vehicles downtown, including City Towing and Greenwood Towing, both of which principally tow from downtown. However, the competition becomes more regionalized in the city’s periphery, and McDel’s Towing, Frankford Towing, Universal Towing, and Jim Elliott’s Towing show strict regions of operation:
That’s it for this week. I hope you enjoyed the post, and stay tuned!
Reproducibility
- R script, geocoding, and basemap
- Department of Transportation towing data
- A re-formatted file of neighborhood polygons